

Key takeaways
- Fill rate is a KPI that measures the number of orders a business is able to fulfill.
- Businesses can use this metric to identify problems with their inventory management, productivity, efficiency, and demand forecasting accuracy.
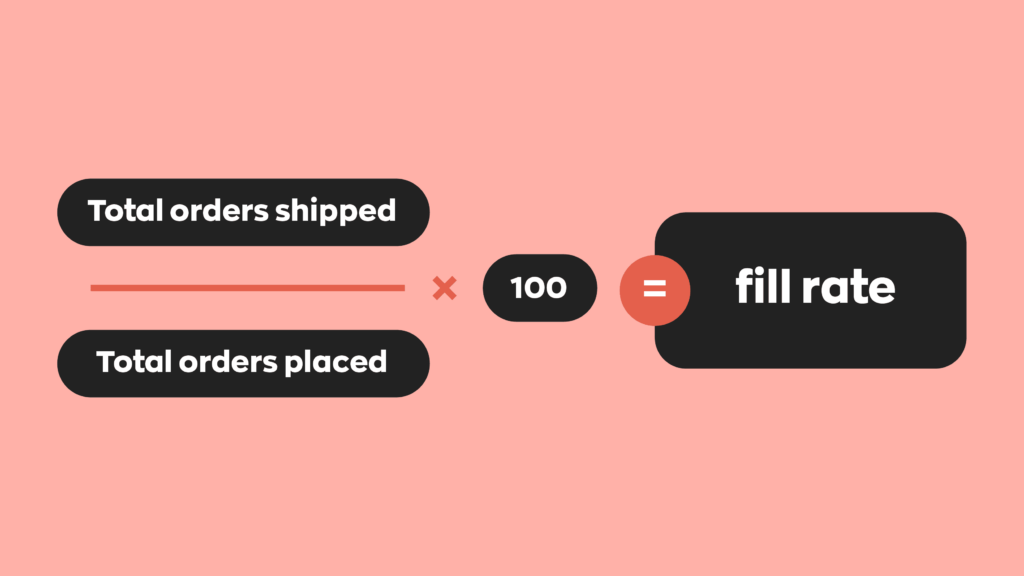
- The fill rate formula is: Total Orders Shipped/Total Orders Placed x 100
- There are several different types of fill rates; some of the most popular are order, line, location, case, and channel.
- When fulfillment is low, there are several steps that can be taken to improve it, such as increasing your available inventory and readjusting your reorder points.
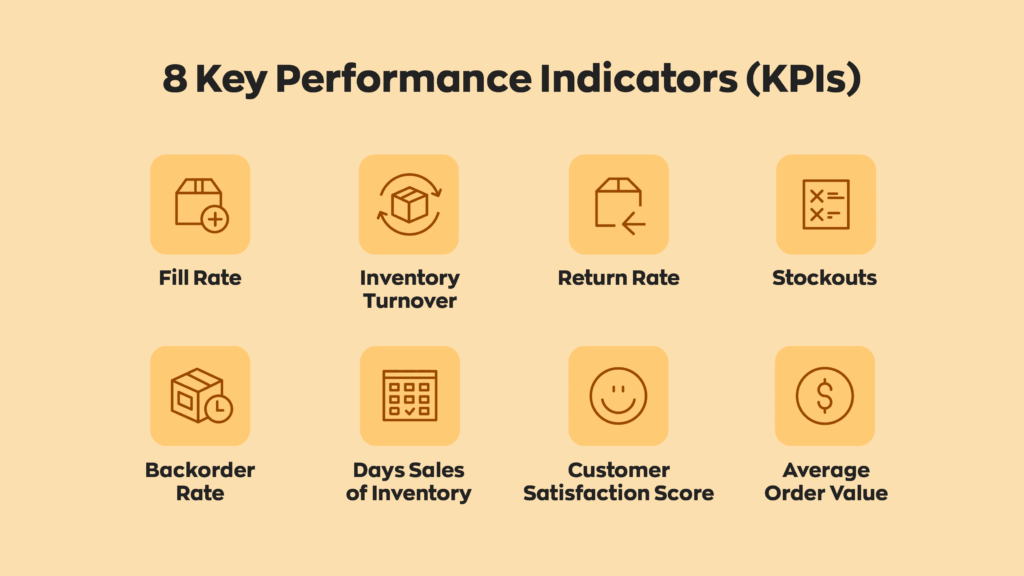
There are many ways to measure a business’s performance. One of, if not the most popular, is by tracking key performance indicators or KPIs. These metrics don’t tell the full story (and numbers alone never will), but they remain a useful business tool. At a glance, they can tell stakeholders whether they’re meeting goals in sales or customer retention.
Among these KPIs, fill rate remains one of the most important. At a glance, it tells businesses their “success ratio” in filling orders and can be useful in raising customer satisfaction. But what’s the definition of fill rate, and how can companies use it to estimate their year-round performance? Let’s find out!
What is fill rate?
The fill rate definition is pretty simple. It’s the percentage of orders a business can fulfill by drawing from existing stock without placing backorders or incurring a stockout. In short, it’s a method that companies use to gauge what portion of market demand they can meet satisfactorily. It’s an application of service rate, which is an attempt to quantify a system’s performance.
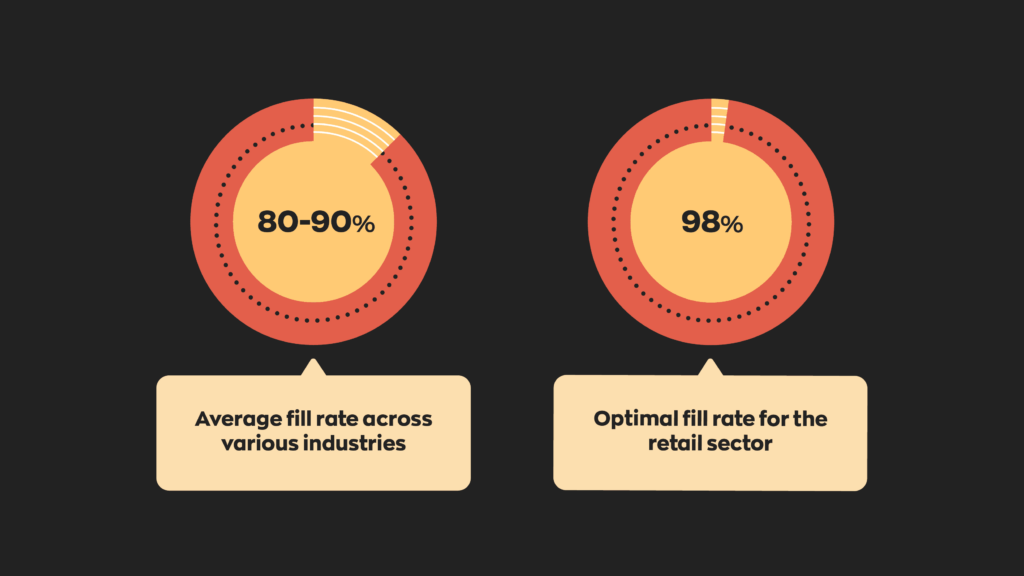
A “good” fill rate can be anywhere from 85% to 95%. Ideally, most maintain 97% to 99%. Achieving 100% is possible in short bursts but realistically impossible in the long term.
Why is fill rate important?
It’s an important metric because it gauges productivity and efficiency in warehouse and shipping teams. Fill rate can also indicate how accurate current demand forecasts are and identify areas that need improvement. Overall, it’s a useful figure that’s easy to calculate.
How to calculate fill rate
Fortunately, the fill rate formula is pretty simple. Here’s what that looks like:
See? Simple! Although it gets a bit trickier when dealing with bigger numbers, service rate remains one of the easiest KPIs to actively track.
Here’s an example.
Let’s say there’s a retailer that sells office chairs. They receive an order of 1,000 units from a company moving into a new office building. They only have 650 units in their storage, so they can’t complete the order in its entirety. Let’s use the fill rate formula with the numbers above.
650/1000 x 100 = fill rate
.65 x 100 = fill rate
65% = fill rate
In this case, the business has a very low fill rate of 65%. This is an indication that the retailer should rethink its inventory management. They may want to consider increasing the amount of inventory they have on hand, readjusting reorder points, and doing more extensive demand forecasting.
Types of fill rate
There are various types of service rates that a business might actively track across multiple departments. They measure the overall success rate of different departments and can highlight areas of potential improvement. Some of the more common types of fill rates are line, order, location, case, and channel. Here’s a brief description of each.
Order
This refers to how many orders the business can fulfill independently. Importantly, this generally means “without issue.” Backorders don’t count. This is the most common metric used but lacks much of the nuance that some of the other fill rates provide.
Line
This fill rate refers to how many line items a shop can fulfill on an order. For example, if a retailer has an order for ten items but can only fulfill five of them, they have a line fill rate of 50%. This metric is a great way to get more granular for companies that sell a lot of different SKUs.
Location
This metric tracks how well a specific location can meet order demands. It’s ideal for anyone who operates from multiple locations, such as storefronts or warehouses. It gives businesses the opportunity to assess which locations are doing the best and make adjustments to ensure everyone is operating efficiently.
Case
This is generally used by merchants who sell in large quantities, like wholesalers and distributors. It measures how many cases of product a company ships out in comparison to orders.
Channel
Most modern businesses take advantage of multiple sales channels. For example, a retailer may have several brick-and-mortar stores but also sell its products online. This metric tells these businesses which sales channels have the highest fill rate.
How can a business improve fill rate?
The main priority for most businesses is optimizing their fulfillment. The higher the fill rate, the higher the revenue. Not only that, it also means more satisfied customers. So, how does your business improve its fulfillment process?
Generally, your business processes, inventory flow, and even your storage space’s physical layout keep fulfillment high. Still, there are a few methods that can kickstart everything. Here are some things to consider.
Forecast demand
It can seem counterintuitive, but maintaining the right amount of stock in the moment requires some foresight. Accurately predicting the right amount to carry keeps capital out of warehouses and reduces the change of stockouts or backorders.
Forecasting demand can be tricky without the proper software. Our software inFlow has fantastic reporting features that give our users valuable data with just a few clicks and relieve the headache of demand forecasting.
Recalculate reorder points
Reorder points are a common practice for inventory management. They ensure your business never runs out of stock and, therefore, will improve your fill rate. Reorder points are calculated considering things like supplier lead time and safety stock to ensure you always maintain optimal inventory levels.
Some business owners think that once they’ve found a good reorder point, they can just leave it indefinitely. But the truth is that these numbers should be updated based on your fulfillment. A low service rate probably means your reorder points are also too low.
Implement software solutions
Software continues to grow in popularity among many different types of businesses. There’s no substitute for hard work and competency, but software makes things significantly easier. Inventory software like inFlow can handle a wide variety of tasks. It can generate reports from historical sales data, help you set reorder points for your products, and then notify you when your stock dips below those levels. It also has purchase orders, sales orders, invoicing, and barcodes.
Wrapping up
KPIs are a good way of quantifying performance at a glance. They won’t tell you everything, but they will give you enough to act on. Among these KPIs, fill rate may be the most important. It measures your business’s reliability in fulfilling orders and is an indicator of overall productivity.


0 Comments